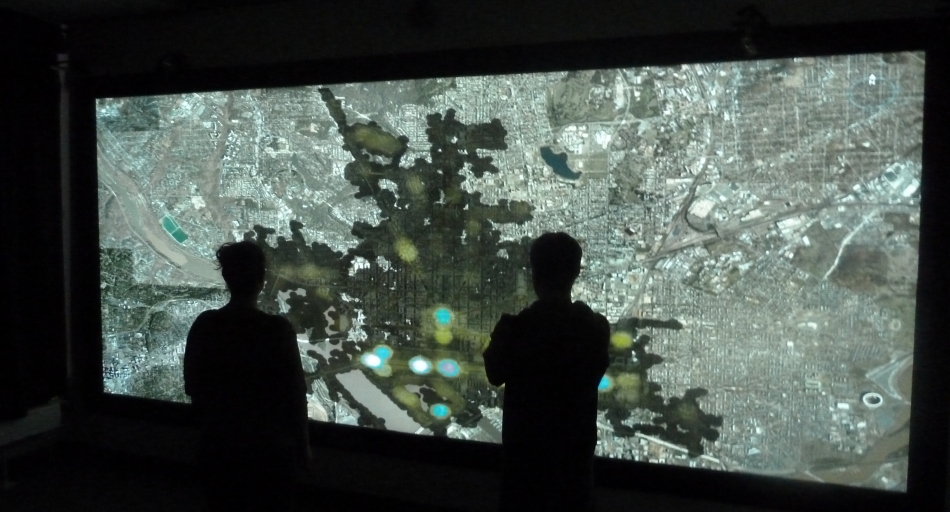
Visual analytics provides technology that combines the strengths of human and electronic data processing. Visualization becomes the medium of a semi-automated analytical process, where human and machine cooperate using their respective distinct capabilities for the most effective results. The user has to be the ultimate authority in giving the direction of the analysis along his or her specific task. At the same time, the system has to provide effective means of interaction to concentrate on this specific task. On top of that, in many applications different people work along the path from data to decision. A visual representation will sketch this path and provide a reference for their collaboration across different tasks and abstraction levels.
The diversity of these tasks cannot be tackled with a single theory. Visual analytics research is highly interdisciplinary and combines various related research areas such as visualization, data analysis, data management, data fusion, statistics and cognition science (among others). One goal of this project is to demonstrate that joining research efforts from these various fields can lead to novel, highly effective analysis tools, contributing solutions to the information overload problem in many important domains. Because visual analytics is an integrating discipline, the existing solutions in the area of critical infrastructures and crisis response will be integrated to support decision making in situations where multiple critical infrastructures are relevant.
